 |
in Wake of Hurricane Sandy
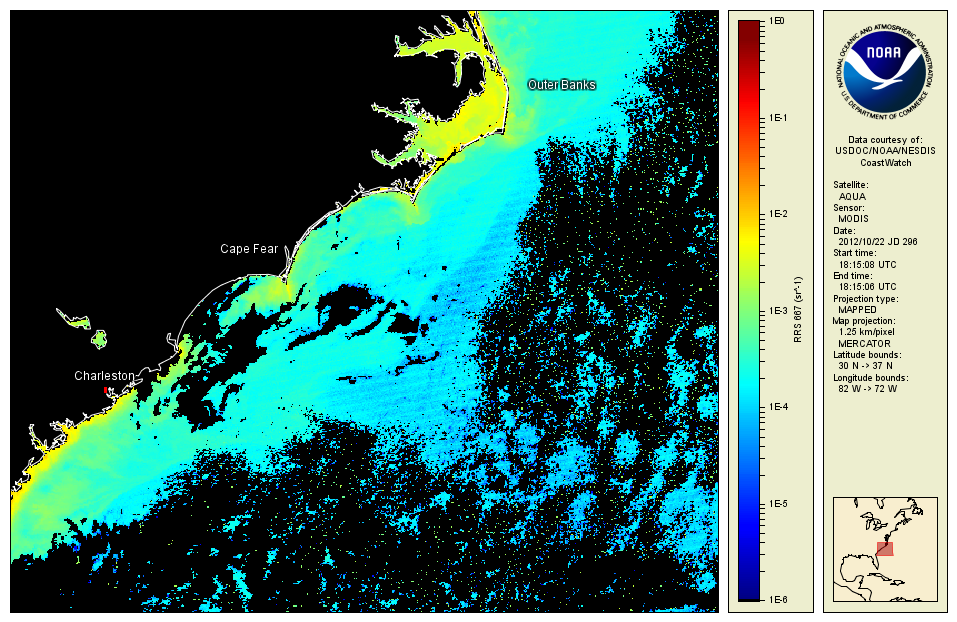
Hurricane Sandy had a tremendous impact on the East Coast. Satellite images were used to track the storm's effects, as in the below series depicting suspended matter (sediment) along the coasts of North and South Carolina.
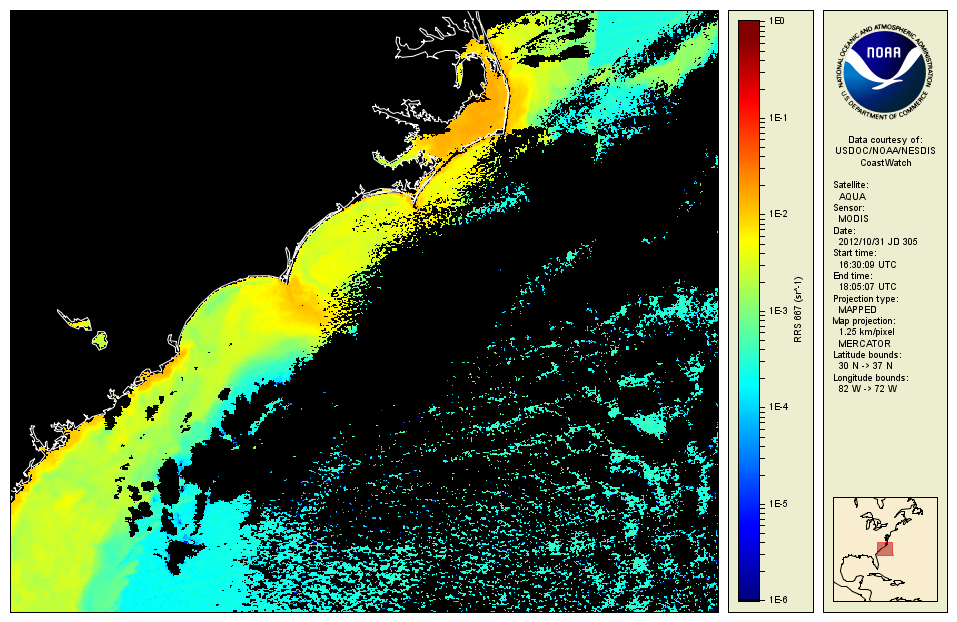
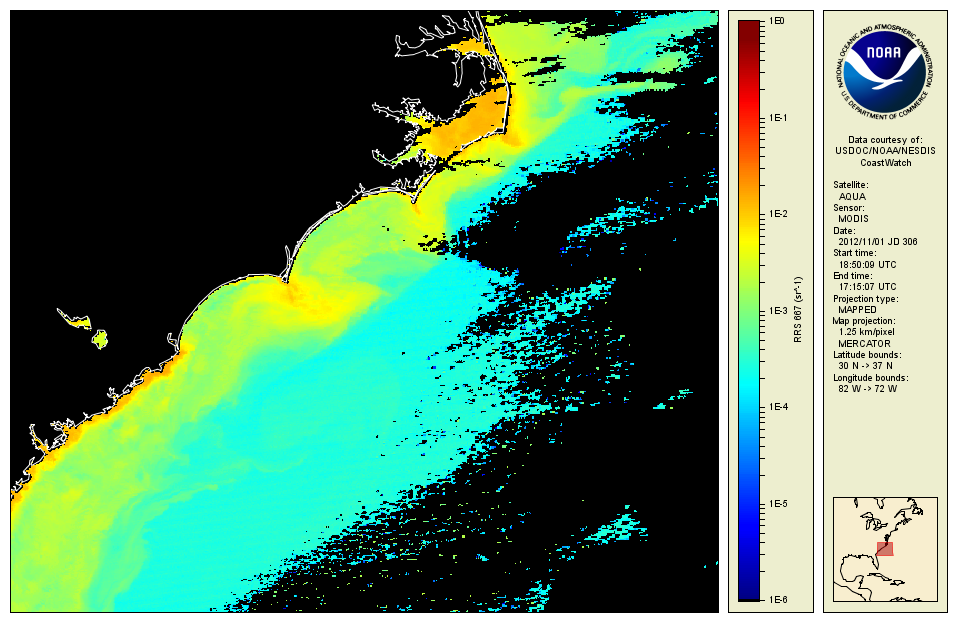
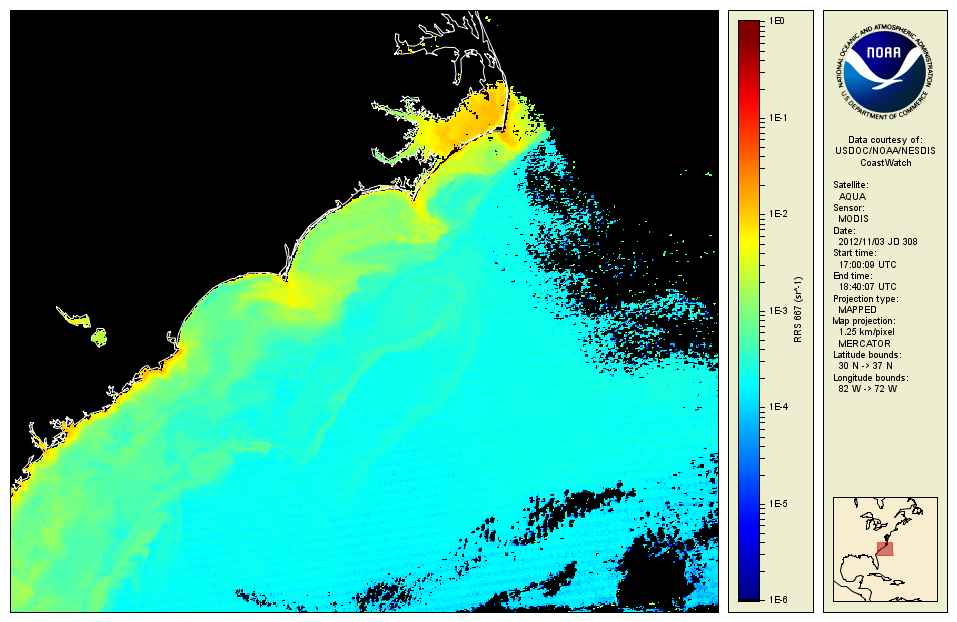
The first image shows coastal suspended matter on October 22, 2012, before the hurricane. Large increases in suspended matter can be seen in the following images on October 31, November 1, and November 3, after the passage of the storm.
| Before: October 22 |
|---|
 |
| After: October 31 |
 |
| After: November 1 |
 |
| After: November 3 |
 |
Wave and current action from the storm churn up bottom sediment along the continental shelf, resulting in very turbid waters with high amounts of suspended matter. Erosion of beaches also contributes to the turbidity of the water as the eroded beach sand is washed offshore from the storm-induced currents.
In the days that follow the storm, the satellite images show a progressive decrease in suspended matter, because the sand and sediment is settling back to the bottom.
Note the sediment plumes at Cape Fear and the inlets of the Outer Banks. The storm's rain runoff from land carries large amounts of sediment to the coast. These plumes contain contaminants, sewage overflows, debris and nutrients (agricultural fertilizers) as the storm flushes these pollutants from the land to the coastal waters, impacting the coastal ecosystem.
Satellites are used to track changes along the coast in the wake of damaging storms such as Sandy. Resource managers use the information from the satellites to focus efforts where damage response is needed and to prioritize investigations of the storm's effects on the ecosystem.
These images were obtained from the MODIS instrument on NASA's Aqua satellite and processed by NOAA CoastWatch. The coastal suspended matter can be seen by the satellite because the material in the water reflects light at red wavelengths. This remote sensing reflectance at red wavelengths is an indicator of suspended matter in the water.
|