 |
|
Chesapeake and Delaware Bays Satellite Data
Data Descriptions and Download Links
SATELLITE IMAGE
CHLOROPHYLL
WATER TEMPERATURE
Satellite Daily Image
select date:
Chlorophyll Daily Image
select date: 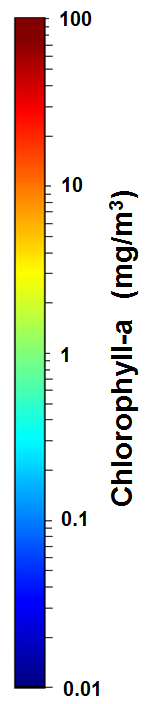
Surface Water Temperature Daily Image
select date: 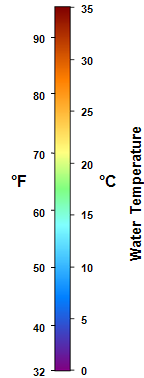
Water Temperature
AVHRR
Surface water temperature from NOAA's Advanced Very High Resolution
Radiometer (AVHRR). Overpasses from all operating AVHRR instruments are
averaged into daily, 3-day, 7-day, monthly, seasonal and annual composites
(composite includes day and night overpasses).
Spatial resolution is nominally 1 km.
More information
AVHRR-VIIRS Multisensor
Surface water temperature combined from the Advanced Very High Resolution Radiometer (AVHRR) and the Visible Infrared Imaging Radiometer Suite (VIIRS).
Overpasses from all operating AVHRR and VIIRS instruments are averaged into
daily, 3-day, 7-day, monthly, and seasonal composites (nighttime only).
Spatial resolution is nominally 750 km.
More information
PODAAC Multiscale Ultrahigh Resolution (MUR)
Surface water temperature analysis from all available infrared and
microwave satellites. Coverage from all satellites and the analysis
method assure cloud-free coverage on a daily basis. Product is
"foundational" SST, i.e. surface temperature before the diurnal heating
begins. Spatial resolution is 1 km.
More information
Chlorophyll-a
MODIS
Chlorophyll-a from the Moderate Resolution Imaging Spectroradiometer (MODIS)
onboard the NASA Aqua satellite, processed using the NOAA OC3 algorithm with
the combined NIR-SWIR atmospheric correction (NOAA OC3 NIR-SWIR).
More information
Previously, chlorophyll from the NASA OC3 NIR algorithm regionally tuned for Chesapeake Bay (Werdell, 2007) had been available. This is now available only by request. More information The Daily Map Viewer (at top of page) diplays MODIS chlorophyll generated from both of the above algorithms: OLCI
Chlorophyll-a from the Ocean and Land Colour Intrument (OLCI) onboard the
European Sentinel-3A and 3B satellites, courtesy of the European Union's
Copernicus satellite program. The data are processed with the European
Space Agency's ocean color 4-band combination chlorophyll-a algorithm (OC4ME)
and the MERIS 1999 Baseline Atmospheric Correction.
More information
VIIRS
Chlorophyll-a from the Visible Infrared Imaging Radiometer Suite (VIIRS)
onboard the Suomi-NPP satellite, processed with the NOAA OC3 algorithm
(Wang et al., 2017) and the NIR atmospheric correction of Jiang & Wang
(2014).
More information
Diffuse Attenuation Coefficient at 490 nm
Diffuse Attenuation Coefficient at 490 nm (Kd-490) measures how strongly light intensity at the specified wavelength (490 nm) is attenuated within the water column. It is a measure of the water's turbidity. MODIS (NASA "KD2" algorithm, 1 km)
MODIS (NOAA/NESDIS algorithm, 1 km)
MODIS (NOAA/NOS algorithm, 250 m)
OLCI (ESA M07 algorithm, 300 m)
VIIRS (NOAA/NESDIS algorithm, 750 m)
Total Suspended Matter
MODIS
OLCI
VIIRS
True Color
East Coast Node filenaming convention Data citation: Please acknowledge "NOAA CoastWatch/OceanWatch" when you use data from our site and cite the particular dataset DOI as appropriate. |
|